In this chapter, you will learn how to:
- Create scatterplots that show the relationship between two variables.
- Identify associations between sets of data and represent the relationship with a trend line.
- Measure the steepness of a line by using slope.
- Find the slope of a line given its equation, its graph, or any two points on the line.
- Find the equation of a trend line to fit linear data.
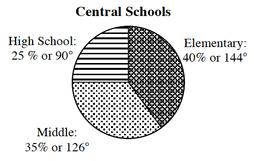
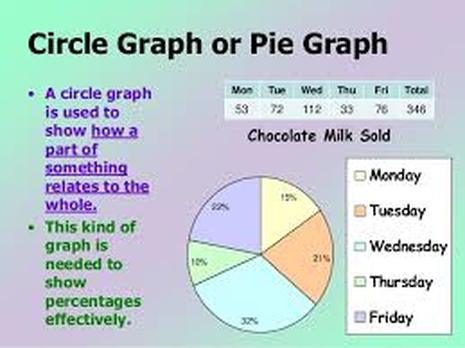
Circle Graphs
|
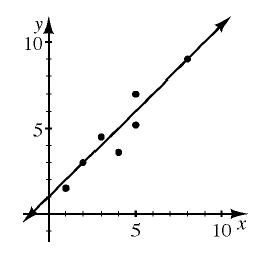
Line of Best Fit
|
Describing Association
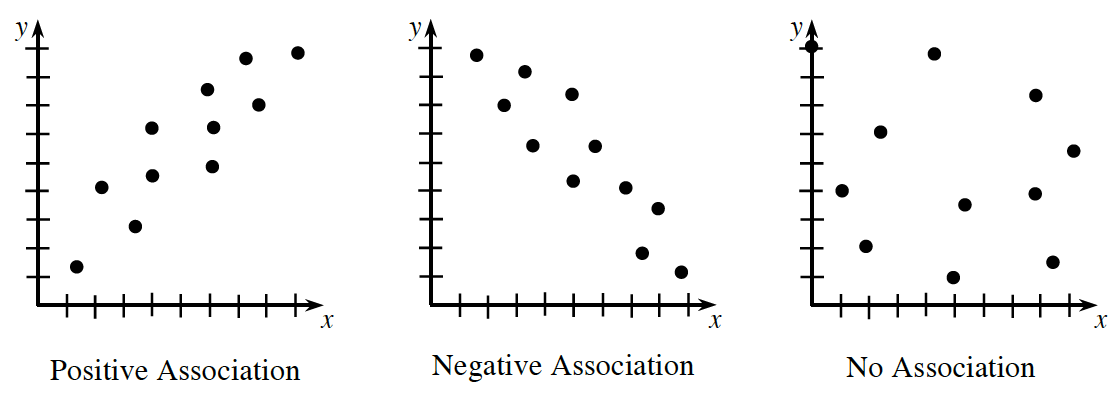
- An association (relationship) between two numerical variables can be described by its form, direction, strength, and outliers.
- If one variable increases as the other variable increases, there is said to be a positive association. If one variable increases as the other variable decreases, there is said to be a negative association. If there is no relationship between the variables, then the points in the scatterplot have no association. An example of each situation is illustrated below.
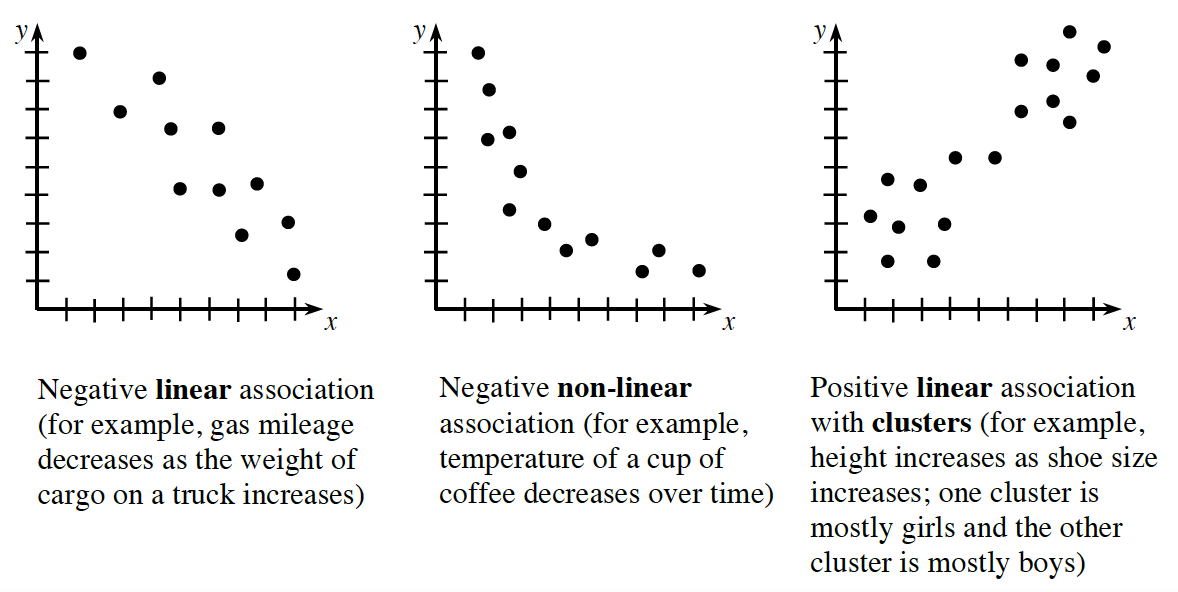
When there is a positive or negative association, the shape of the pattern is called the form of the association. Associations can have a linear form or a non-linear-form, and the form can be made up of clusters of data. See some examples below.
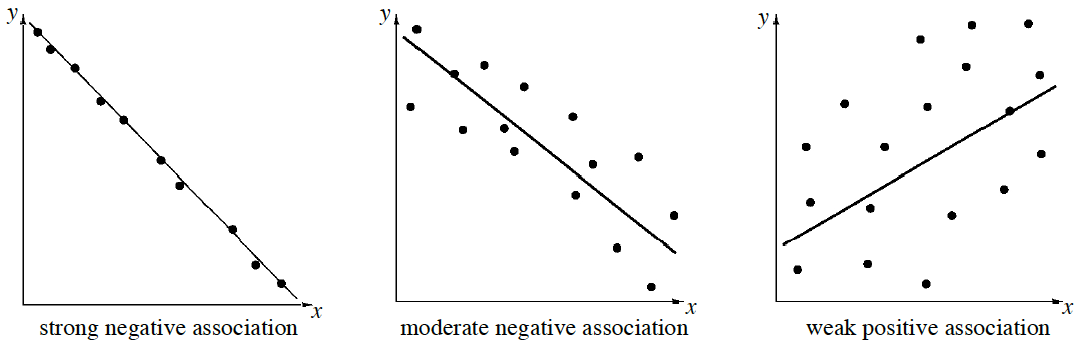
Although considering the direction of an association (positive or negative) is important in describing it, it is just as important to consider the strength of the association. Strength is a description of how much scatter there is in the data away from the line of best fit. Examples are shown below.
Although considering the direction of an association (positive or negative) is important in describing it, it is just as important to consider the strength of the association. Strength is a description of how much scatter there is in the data away from the line of best fit. Examples are shown below.
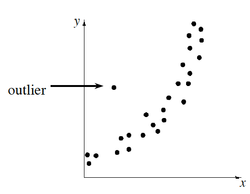
An outlier is a piece of data that does not seem to fit into the pattern. There is one obvious outlier in the association on the graph at right.
Slope of a Line
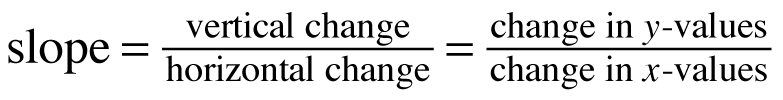
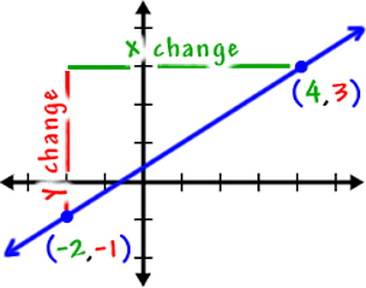
- The slope of a line is the ratio of the change in y to the change in x between any two points on the line.
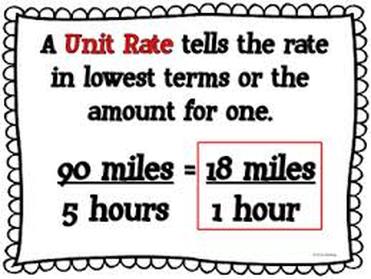
- To find slope, you compute the ratio that indicates how y‑values are changing with respect to x‑values. Essentially, slope is the unit rate of change, because it measures how much y increases or decreases as x changes by one unit.
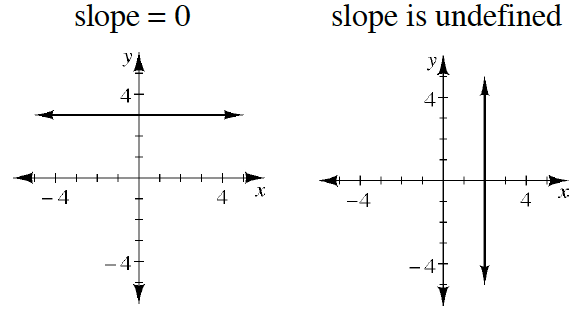
- If the slope is positive (+), the y‑values are increasing. If it is negative (–), the y‑values are decreasing. The graph of a line goes up for positive slopes and down for negatives slopes as the line moves across the graph from left to right.
Positive Slope: 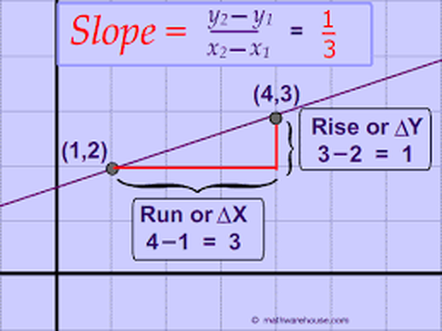
|
Negative Slope: 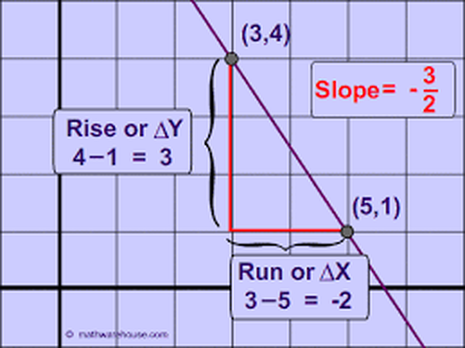
|
Proportional Equations
- A proportional relationship can be seen in a table or a graph, as you saw in Section 1.2 of Chapter 1. The equation for a proportion is y = kx, where k is the constant of proportionality, or the slope of the line. The starting point of the linear equation is always zero, because a proportional relationship always passes through the origin.
- The constant of proportionality, when written as a fraction with a denominator of 1, is the unit rate.