In this chapter, you will learn:
- How to add or multiply by a constant to transform liner, quadratic, and exponential functions.
- How to "undo" functions to find the inverse function
- To find differences between graphical and representations of single-variable data using a scatter plot or two histograms to compare two-variable data
- How to develop a way to describe a distribution, including standard deviation
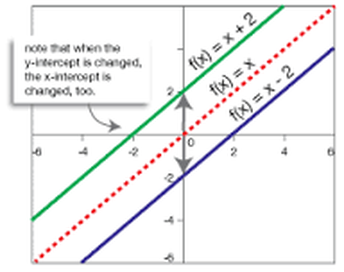
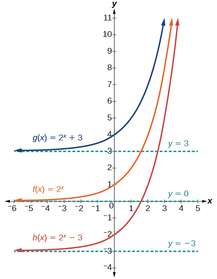
Translating Functions:
|
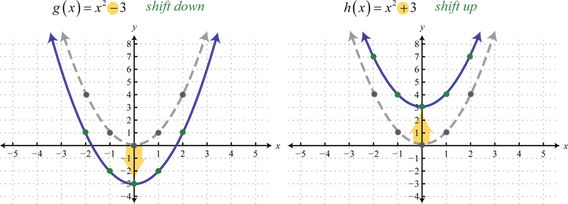
ADDING a constant to a function:
|
|
MULTIPLYING a constant to a function:
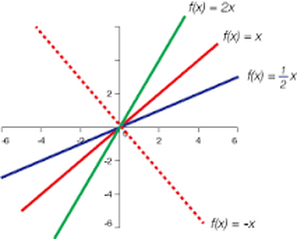
|
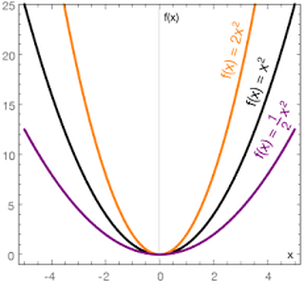
|
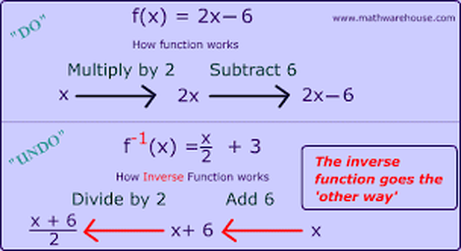
Inverse Functions:
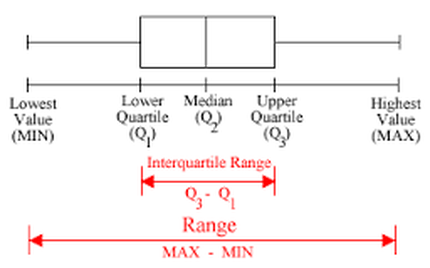
Interquartile Range and Boxplots
- Quartiles are points that divide a data set into four equal parts (and thus, the use of the prefix “quar” as in “quarter”). One of these points is the median. The first quartile (Q1) is the median of the lower half, and the third quartile (Q3) is the median of the upper half. To find quartiles, the data set must be placed in order from smallest to largest. Note that if there are an odd number of data values, the median is not included in either half of the data set.
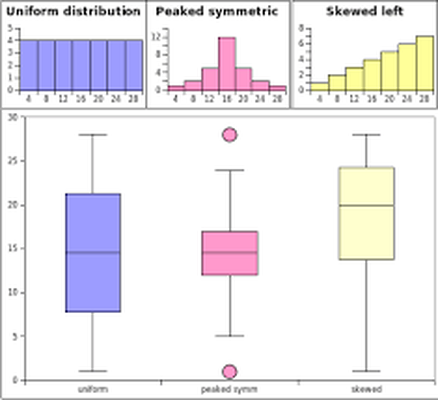
- A boxplot (also known as a box-and-whisker plot) displays a five number summary of data: minimum, first quartile, median, third quartile, and maximum. The box contains “the middle half” of the data and visually displays how large the IQR is. The right segment represents the top 25% of the data and the left segment represents the bottom 25% of the data. A boxplot makes it easy to see where the data are spread out and where they are concentrated. The wider the box, the more the data are spread out.
- Outliers are any data values that are far away from the bulk of the data distribution. In the example at right, data values in the right-most bin are outliers. Outliers are marked on a modified boxplot with a dot.
- Interquartile Range (IQR)
The variability, or spread, in the distribution can be numerically summarized with the interquartile range (IQR). The IQR is found by subtracting the first quartile from the third quartile. The IQR is the range of the middle half of the data. IQR can represent the spread of any data distribution, even if the distribution is not symmetric or has outliers. - Standard Deviation
Either the interquartile range or standard deviation can be used to represent the spread if the data is symmetric and has no outliers. The standard deviation is the square root of the average of the distances to the mean, after the distances have been made positive by squaring.